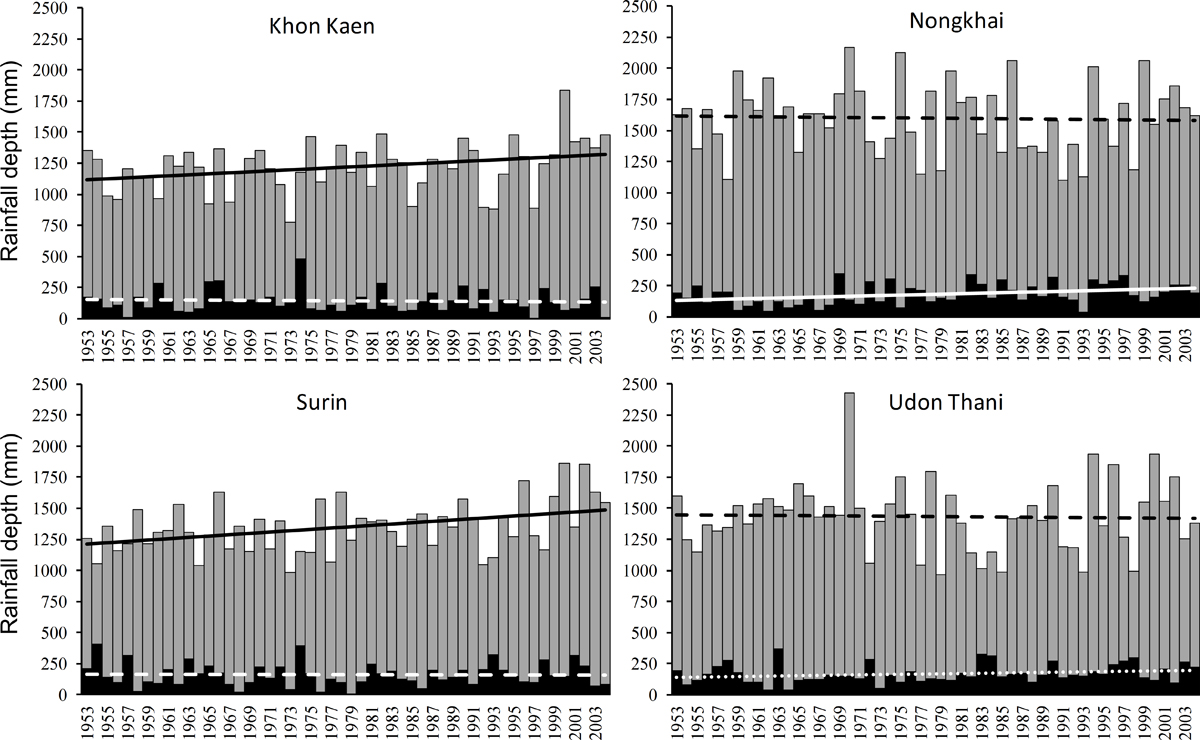
Fig. 3

Download original image
Time series for annual (grey) and dry season rainfall (black). Solid trend line is significant at 95% confidence level. Dotted trend line is significant at 90% confidence level. Dashed trend line is statistically insignificant.
Chroniques des pluies annuelles (gris) et de saison sèche (noir). Ligne continue : tendance significative au seuil de 95 %. Ligne pointillée : tendance significative au seuil de 90 %. Ligne en tirets : tendance non significative.
Current usage metrics show cumulative count of Article Views (full-text article views including HTML views, PDF and ePub downloads, according to the available data) and Abstracts Views on Vision4Press platform.
Data correspond to usage on the plateform after 2015. The current usage metrics is available 48-96 hours after online publication and is updated daily on week days.
Initial download of the metrics may take a while.


