")
")
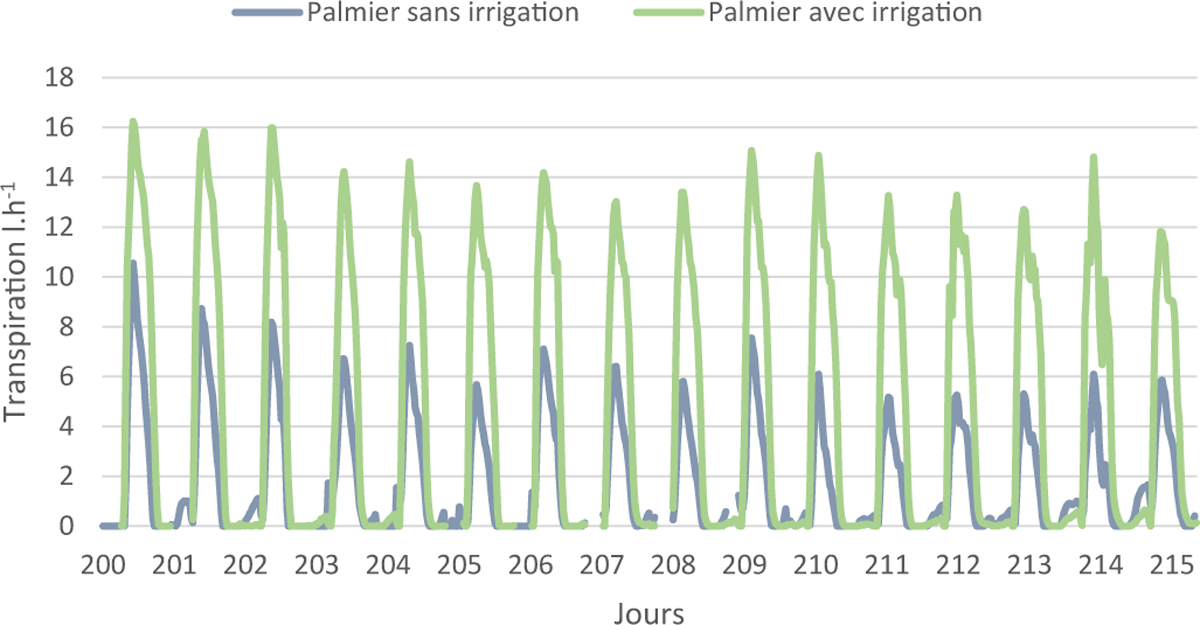
Fig. 7
Download original image
Comparaison de la variation journalière du flux pour deux palmiers voisins durant une période de forte demande climatique (18 juillet au 2 août), l'un avec irrigation et l'autre sans irrigation. La première courbe (bleue) représente le palmier non irrigué et la seconde courbe (verte) représente le palmier irrigué.
Comparison of the daily flow variation for two neighboring palms during a period of high climatic demand (18 July to 2 August). The first curve (blue) represents the non-irrigated palm tree and the second curve (green) represents the irrigated palm tree.
Current usage metrics show cumulative count of Article Views (full-text article views including HTML views, PDF and ePub downloads, according to the available data) and Abstracts Views on Vision4Press platform.
Data correspond to usage on the plateform after 2015. The current usage metrics is available 48-96 hours after online publication and is updated daily on week days.
Initial download of the metrics may take a while.