")
")
Open Access
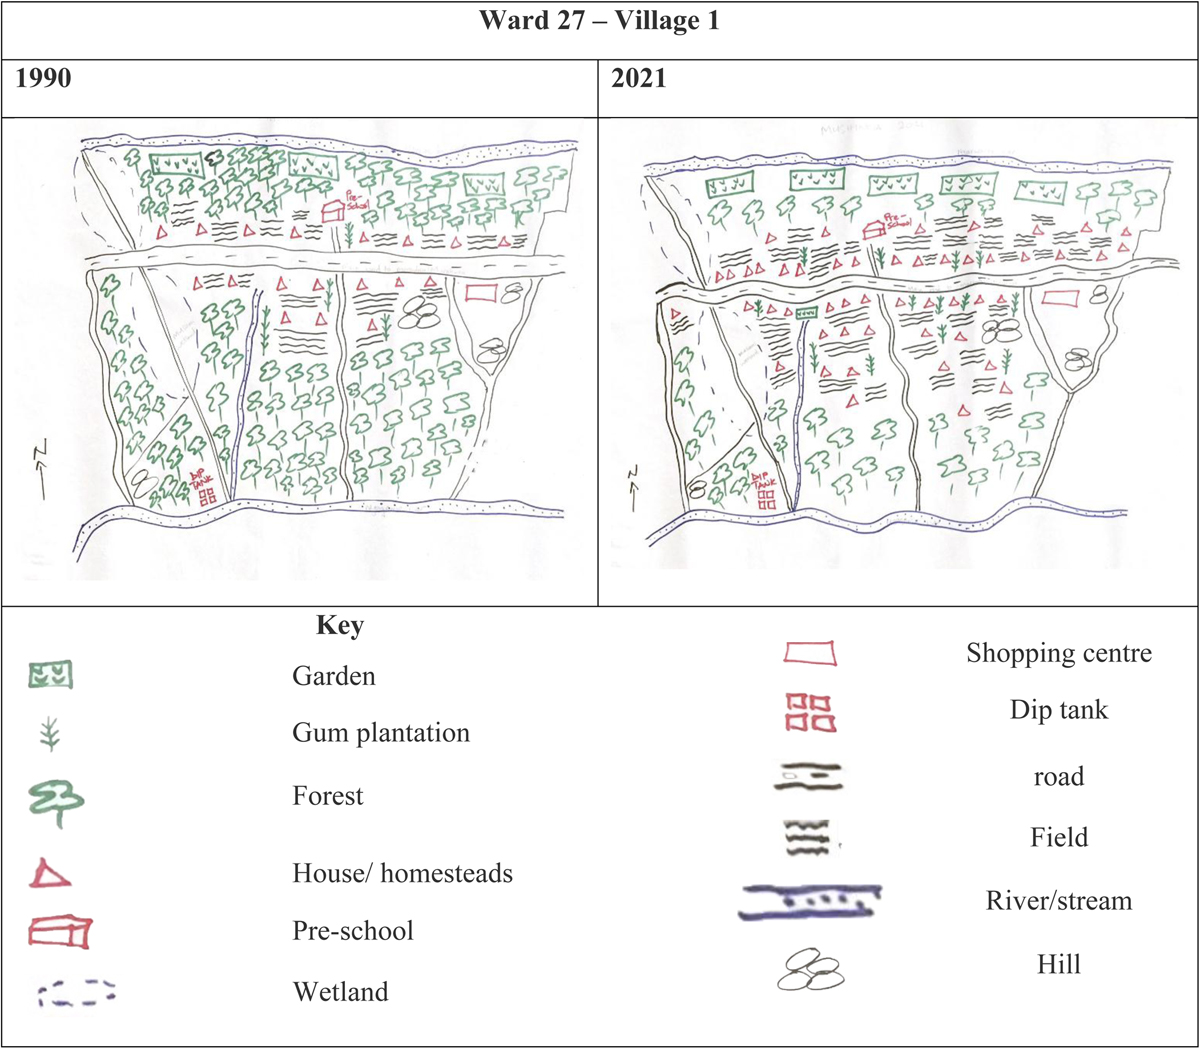
Fig. 4
Download original image
Participatory maps showing changes in land use in 1990 and 2021 in Ward 27.
Cartes participatives montrant les changements d’occupation des sols en 1990 et 2021 dans le quartier 27.
Current usage metrics show cumulative count of Article Views (full-text article views including HTML views, PDF and ePub downloads, according to the available data) and Abstracts Views on Vision4Press platform.
Data correspond to usage on the plateform after 2015. The current usage metrics is available 48-96 hours after online publication and is updated daily on week days.
Initial download of the metrics may take a while.