")
")
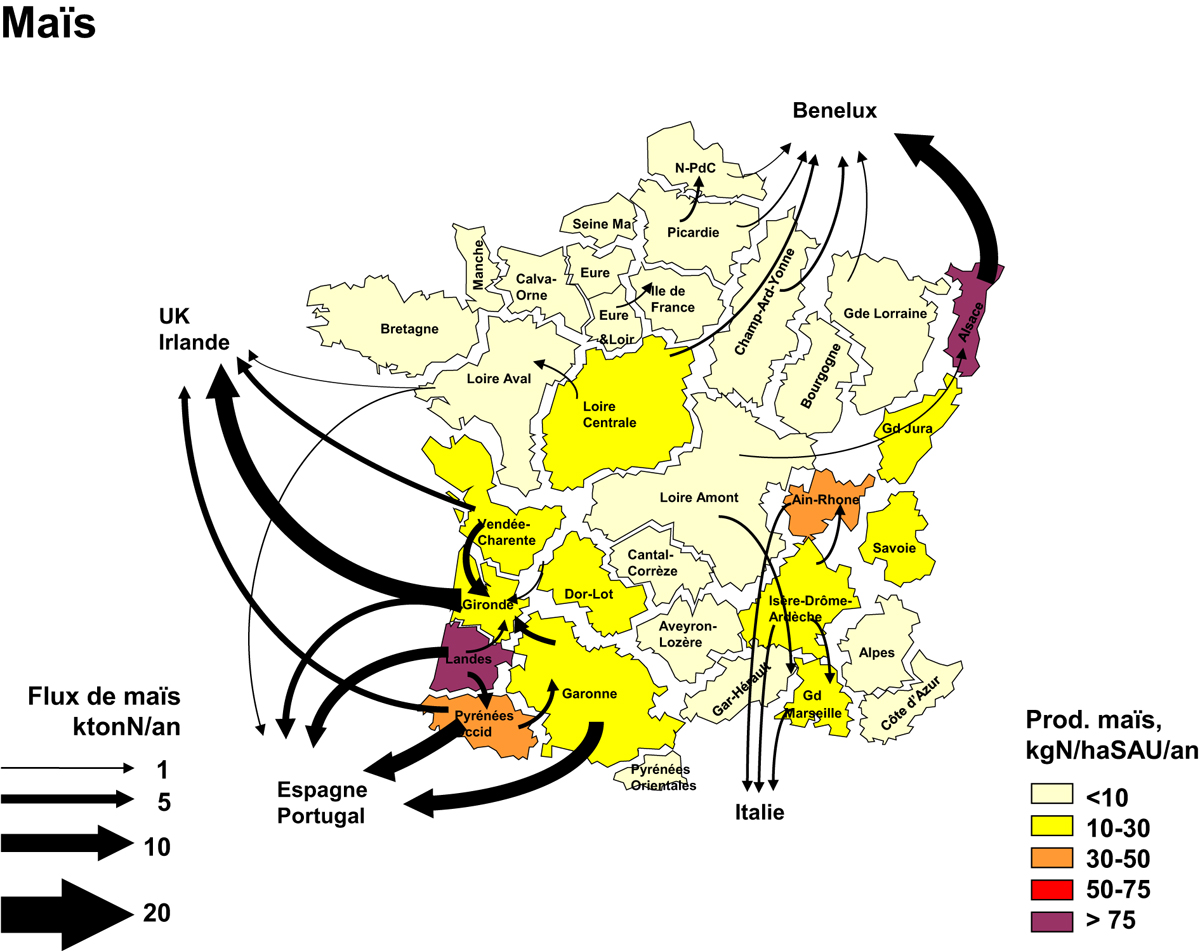
Fig. 3
Download original image
Principaux flux nets de maïs échangés entre territoires agricoles. L’épaisseur des flèches est proportionnelle à l’importance du flux. En fond de carte est indiquée par un code couleur la production de maïs par unité de SAU totale de chaque région.
Main net fluxes of maize exchanged between agricultural territories. The width of the arrows is proportional to the flux intensity. Maize production per unit of total agricultural surface is indicated by a colour scale.
Current usage metrics show cumulative count of Article Views (full-text article views including HTML views, PDF and ePub downloads, according to the available data) and Abstracts Views on Vision4Press platform.
Data correspond to usage on the plateform after 2015. The current usage metrics is available 48-96 hours after online publication and is updated daily on week days.
Initial download of the metrics may take a while.