Fig. 4

Download original image
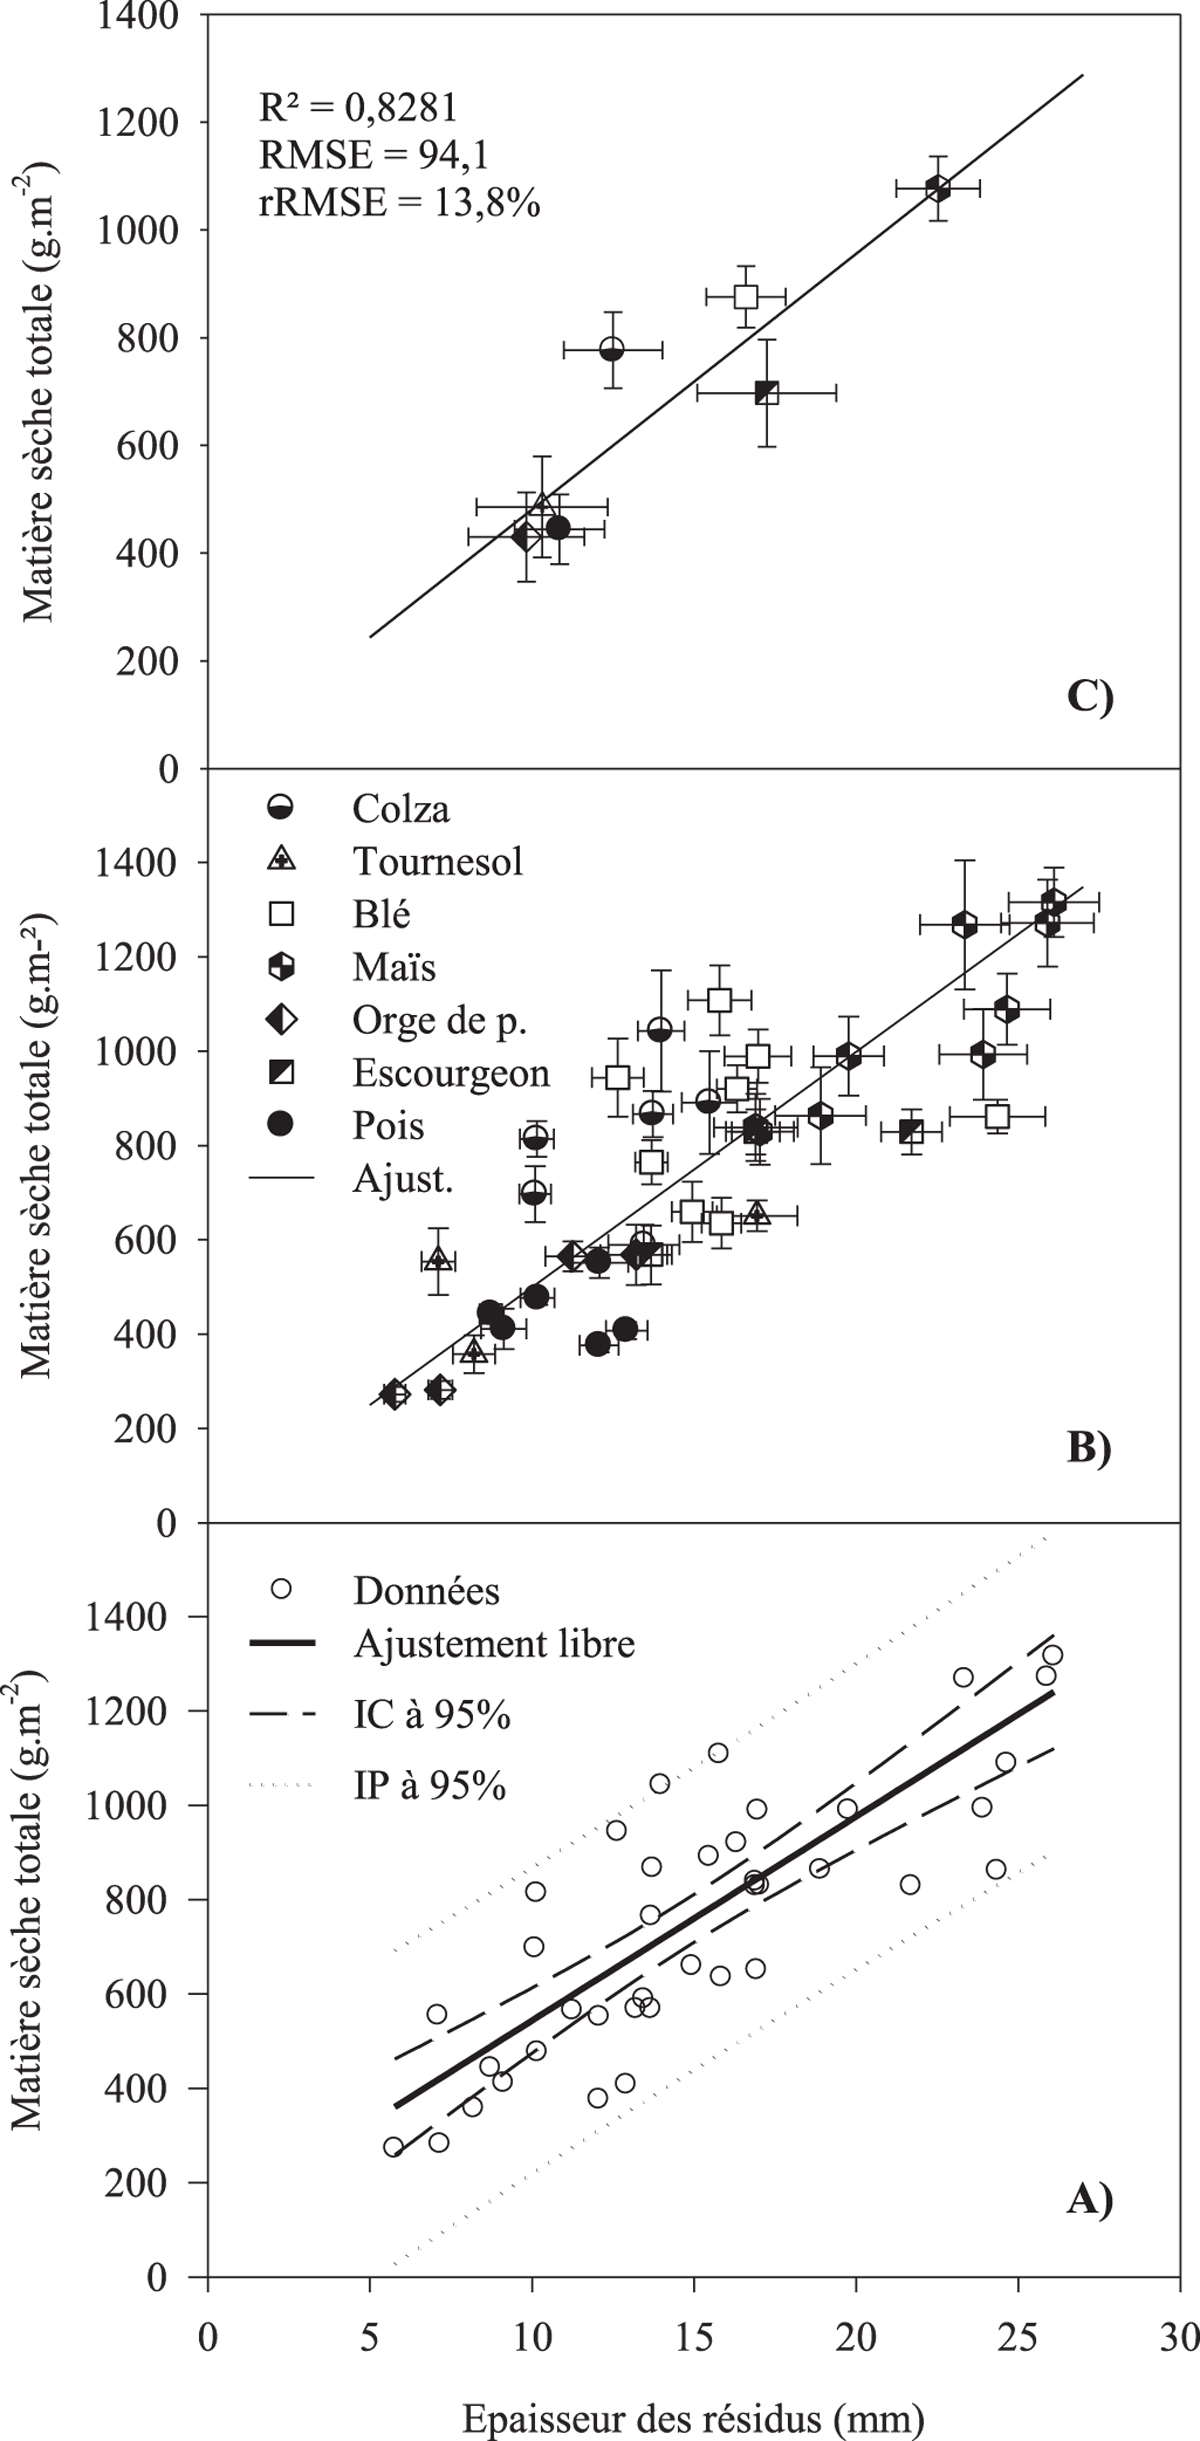
Relation entre l’épaisseur de résidus (mm) et la quantité de matière sèche totale de résidus présents à la surface du sol (g MST.m−2). A) Données accompagnées des tracés de l’ajustement libre, des intervalles de confiance et de prédiction ; B) Distribution et identification des cultures accompagnées de leur erreur standard autour de l’ajustement forcé par l’origine ; C) Distribution et identification des moyennes par espèce accompagnées de leur erreur standard autour de l’ajustement libre.
Relation between the measured thickness (mm) and the amount of total dry matter residues on the soil surface (g TDM.m−2). A) Data accompanied by the plots of free fit, confidence intervals and prediction ; B) Distribution and identification of crops accompanied by their standard error around forced adjustment by origin; C) distribution and identification of means by species accompanied by their standard error around free adjustment.
Current usage metrics show cumulative count of Article Views (full-text article views including HTML views, PDF and ePub downloads, according to the available data) and Abstracts Views on Vision4Press platform.
Data correspond to usage on the plateform after 2015. The current usage metrics is available 48-96 hours after online publication and is updated daily on week days.
Initial download of the metrics may take a while.


