")
")
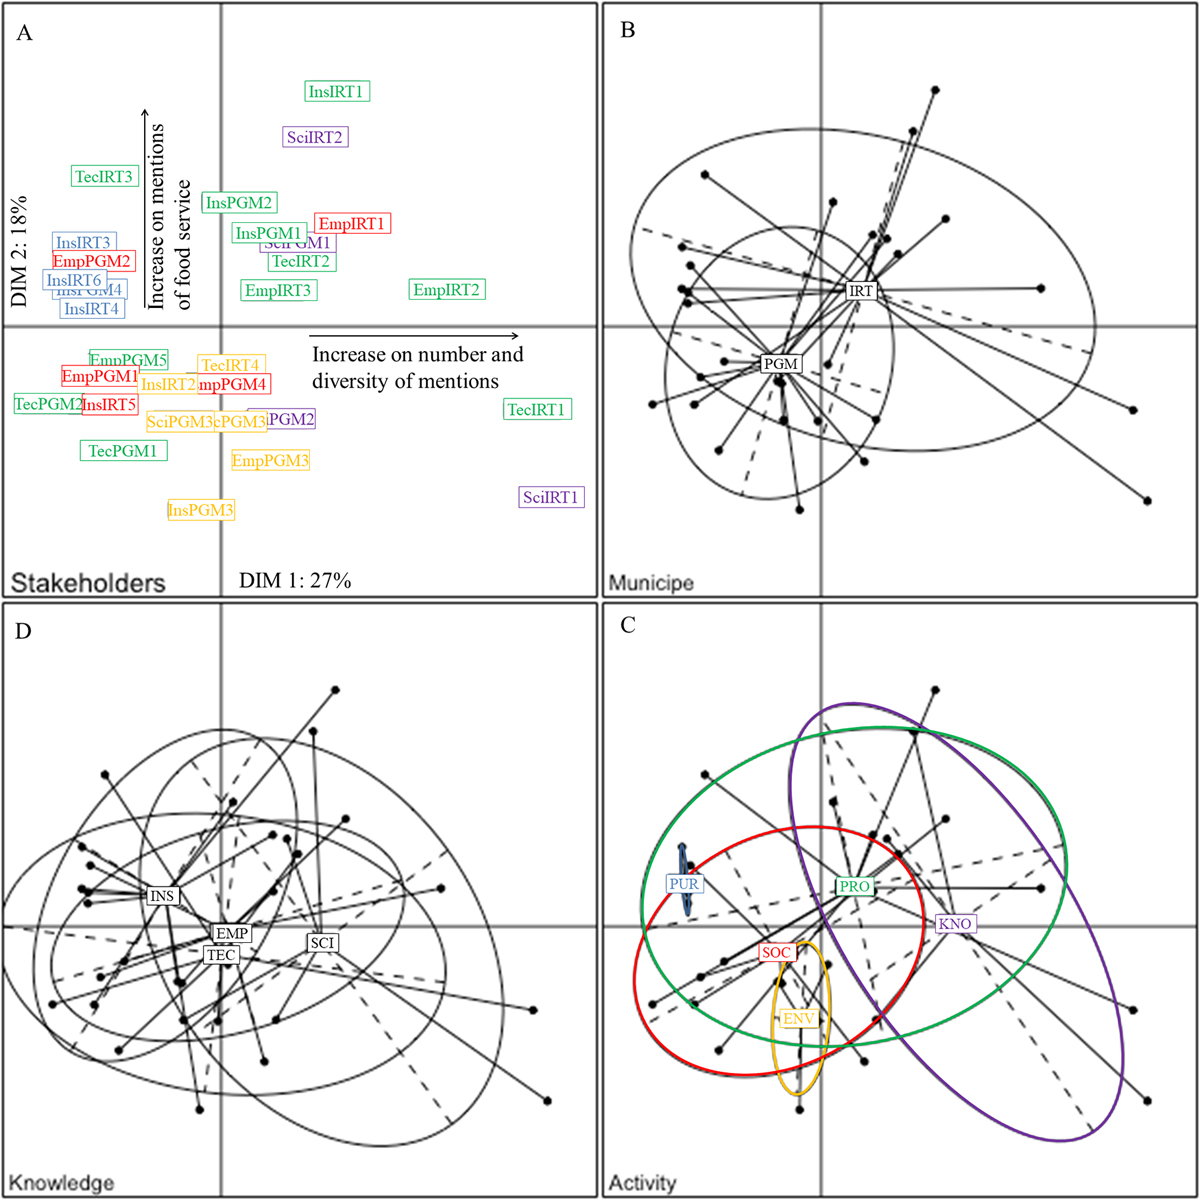
Fig. 2
Download original image
Multidimensional Scaling (MDS) outcomes. (A) Projections on the two first MDS axes of the stakeholders. (B–D) Variability of stakeholder responses according to: location (Paragominas, PGM; Irituia, IRT), activity (production support, PRO; purchase of products, PUR; environmental regularization, ENV; social support, SOC; knowledge production, KNO) and knowledge type (institutional, INS; technical, TEC; scientific, SCI; empirical, EMP). The label of each factor’s modality appears at the average MDS coordinates of the stakeholders who belong to the modality concerned. An inertia ellipse containing 95% of the points is shown to illustrate the variability of the distribution of ecosystem services perception by stakeholders within each modality.
Résultats du MDS. (A) Projections sur les deux premiers axes du MDS des acteurs. (B–D) Variabilité des réponses des acteurs en fonction de la municipalité (Paragominas, PGM ; Irituia, IRT), l’activité (soutien à la production, PRO ; achat de produits, PUR ; réglementation environnementale, ENV ; soutien social, SOC ; production de connaissance, KNO) et type de connaissance (institutionnel, INS ; technique, TEC ; scientifique, SCI ; empirique, EMP). La position du label de la modalité de chaque facteur correspond à la moyenne des coordonnées MDS des acteurs qui appartiennent à la modalité concernée. Une ellipse d’inertie contenant 95 % des points est présentée pour illustrer la variabilité de la distribution de la perception des services écosystémiques par les acteurs au sein de chaque modalité.
Current usage metrics show cumulative count of Article Views (full-text article views including HTML views, PDF and ePub downloads, according to the available data) and Abstracts Views on Vision4Press platform.
Data correspond to usage on the plateform after 2015. The current usage metrics is available 48-96 hours after online publication and is updated daily on week days.
Initial download of the metrics may take a while.