")
")
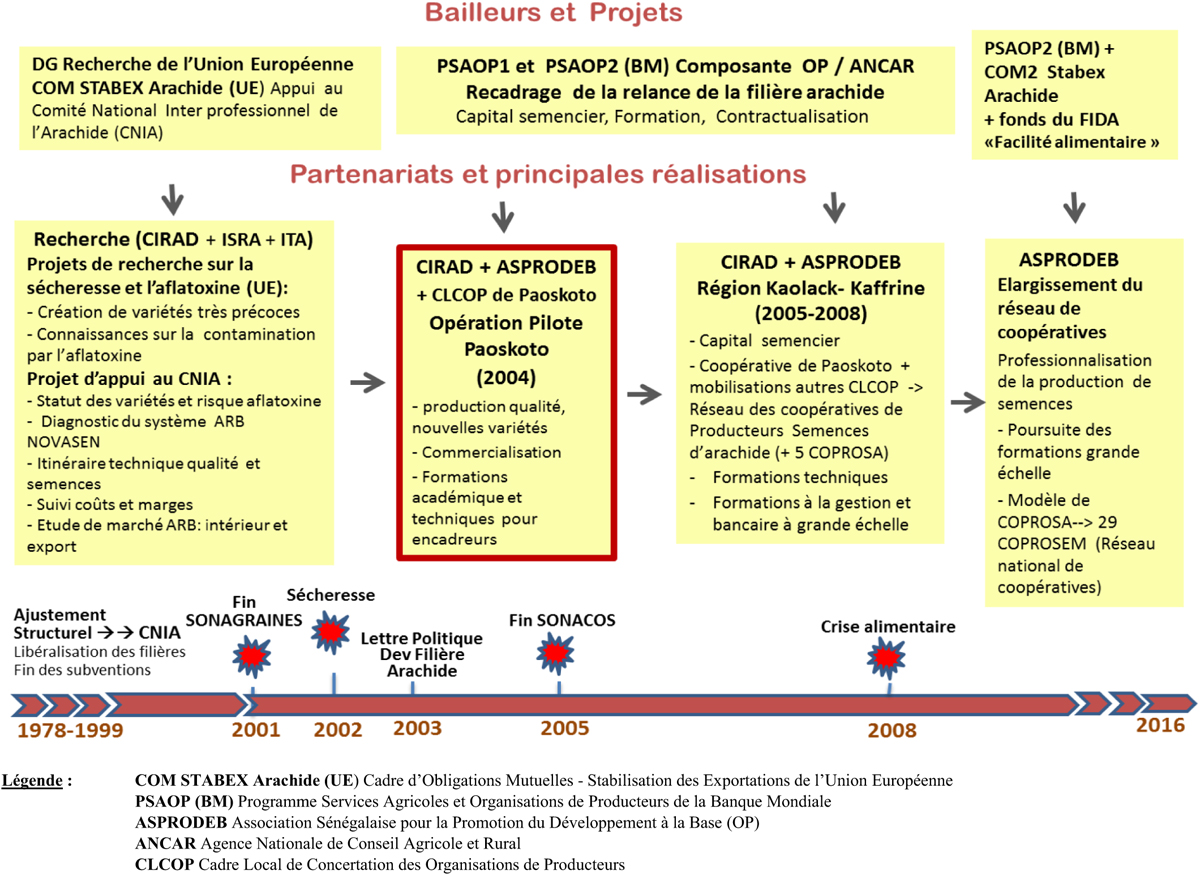
Fig. 2
Download original image
Diagramme chronologique des activités de recherche et développement sur l’arachide de 1999 à 2016.
Chronological diagram of groundnut research and development activities from 1999 to 2016.
Current usage metrics show cumulative count of Article Views (full-text article views including HTML views, PDF and ePub downloads, according to the available data) and Abstracts Views on Vision4Press platform.
Data correspond to usage on the plateform after 2015. The current usage metrics is available 48-96 hours after online publication and is updated daily on week days.
Initial download of the metrics may take a while.