Table 1
Overview of different methodological steps and tools used for data collection and analysis.
Aperçu des différentes étapes méthodologiques et des outils utilisés pour la collecte et l’analyse des données.
| Steps | Methods | ||
|---|---|---|---|
| 1 | Literature review | – Review of relevant academic articles, reports and associated documents – Use of existing data from maps, reports and similar sources |
|
| 2 | Selection of case studies | – Participatory diagnosis – Participatory mapping |
|
| 3 | Historical analysis of RWSS trajectory in selected case studies | – Participant observation – Life narratives – Semi-structured interviews (15 in Tunisia and 20 in Brazil; individual and group interviews; virtual and in-person meetings) with key stakeholders: community health agent, water users’ association members, district engineers, and local water technicians. |
|
| 4 | Analysis of the functioning of the RWSS | Surveys (30 in Tunisia and 40 in Brazil) to collect information at the household and community levels on: – Water users – Water uses (drinking, domestic, agricultural) – Infrastructures (lay-out, quality, location) – Resources (quantity, quality, location) – Rules of use (formal and informal) – Evolutions and adaptations in infrastructure and rules |
|
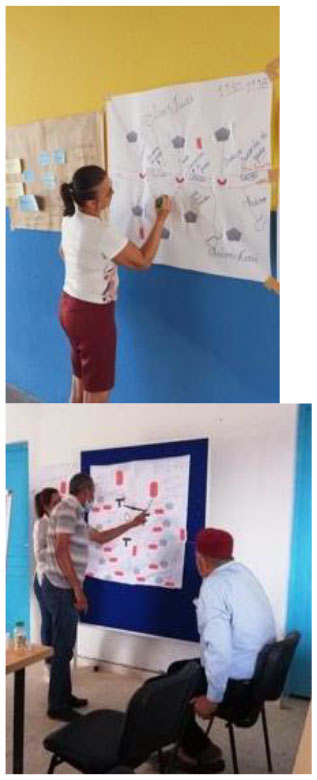
| 5 | Co-design of RWSS trajectories | Participatory modeling: using a conceptual model as a discussion support Workshops in Tunisia and Brazil Tunisia: – 10 interviews to prepare the workshop – 1 workshop mixing both communities (Ouled Salah and Ouled Om Hani) – 12 participants: 4 women and 8 men (6 from Ouled Salah and 6 from Ouled Om Hani communities) Brazil: – 12 interviews to prepare the workshops – 1 workshop in Santa Maria community – 8 participants (4 women and 4 men) – 1 workshop in in Varzea do Meio community – 8 participants (4 women and 4 men) |
|

|
|||
Current usage metrics show cumulative count of Article Views (full-text article views including HTML views, PDF and ePub downloads, according to the available data) and Abstracts Views on Vision4Press platform.
Data correspond to usage on the plateform after 2015. The current usage metrics is available 48-96 hours after online publication and is updated daily on week days.
Initial download of the metrics may take a while.


