Fig. 3

Download original image
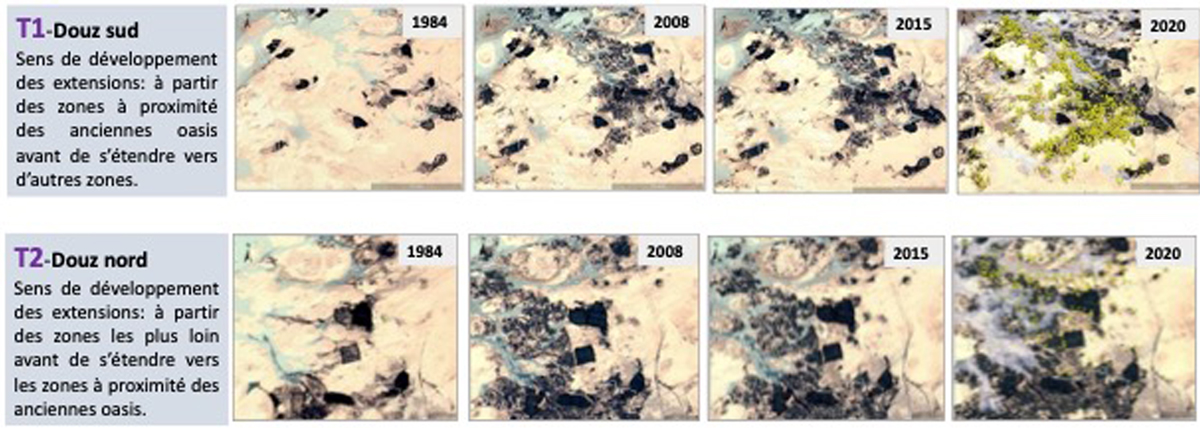
Évolution spatio-temporelle des extensions dans les délégations de Douz Sud et Douz Nord (1984-2008-2015-2020). Réalisé par les auteurs à partir d’images satellites (Sentinel-2 et Google Earth) et des enquêtes. Les points jaunes représentent le pompage à énergie solaire.
Spatial and temporal evolution of extensions in the delegations of Douz South and Douz North (1984-2008-2015-2020). Produced by the authors using satellite images (Sentinel-2 and Google Earth) and surveys. The yellow dots represent solar-powered pumps.
Current usage metrics show cumulative count of Article Views (full-text article views including HTML views, PDF and ePub downloads, according to the available data) and Abstracts Views on Vision4Press platform.
Data correspond to usage on the plateform after 2015. The current usage metrics is available 48-96 hours after online publication and is updated daily on week days.
Initial download of the metrics may take a while.


