")
")
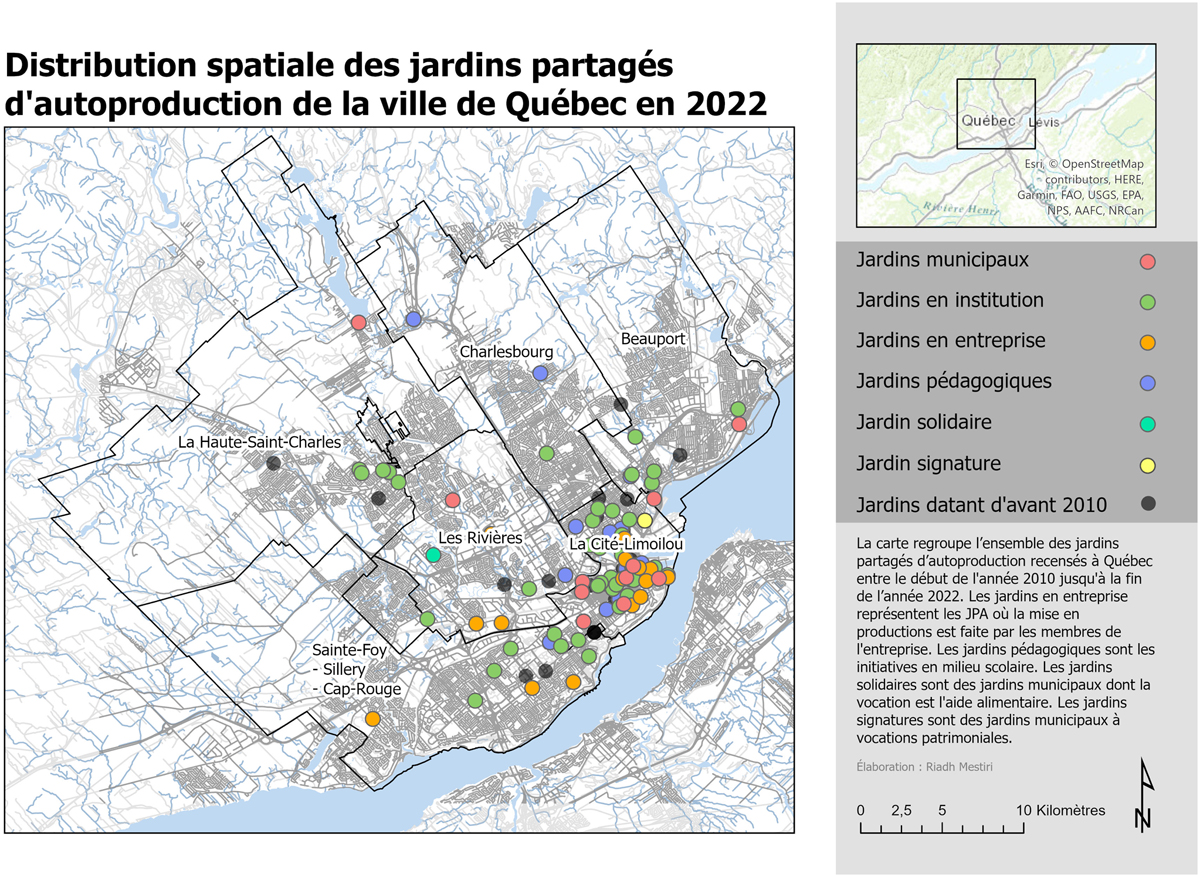
Figure 3
Download original image
Distribution spatiale des JPA à la fin de l’année 2022.
* Nous avons choisi d’élargir les données de la décennie 2010 jusqu’en 2022 pour présenter des informations plus à jour.
Spatial distribution of SGS at the end of 2022.* We have chosen to extend the data from the 2010 decade to 2022 to present more up-to-date information.
Current usage metrics show cumulative count of Article Views (full-text article views including HTML views, PDF and ePub downloads, according to the available data) and Abstracts Views on Vision4Press platform.
Data correspond to usage on the plateform after 2015. The current usage metrics is available 48-96 hours after online publication and is updated daily on week days.
Initial download of the metrics may take a while.