")
")
Open Access
Fig. 2
Download original image
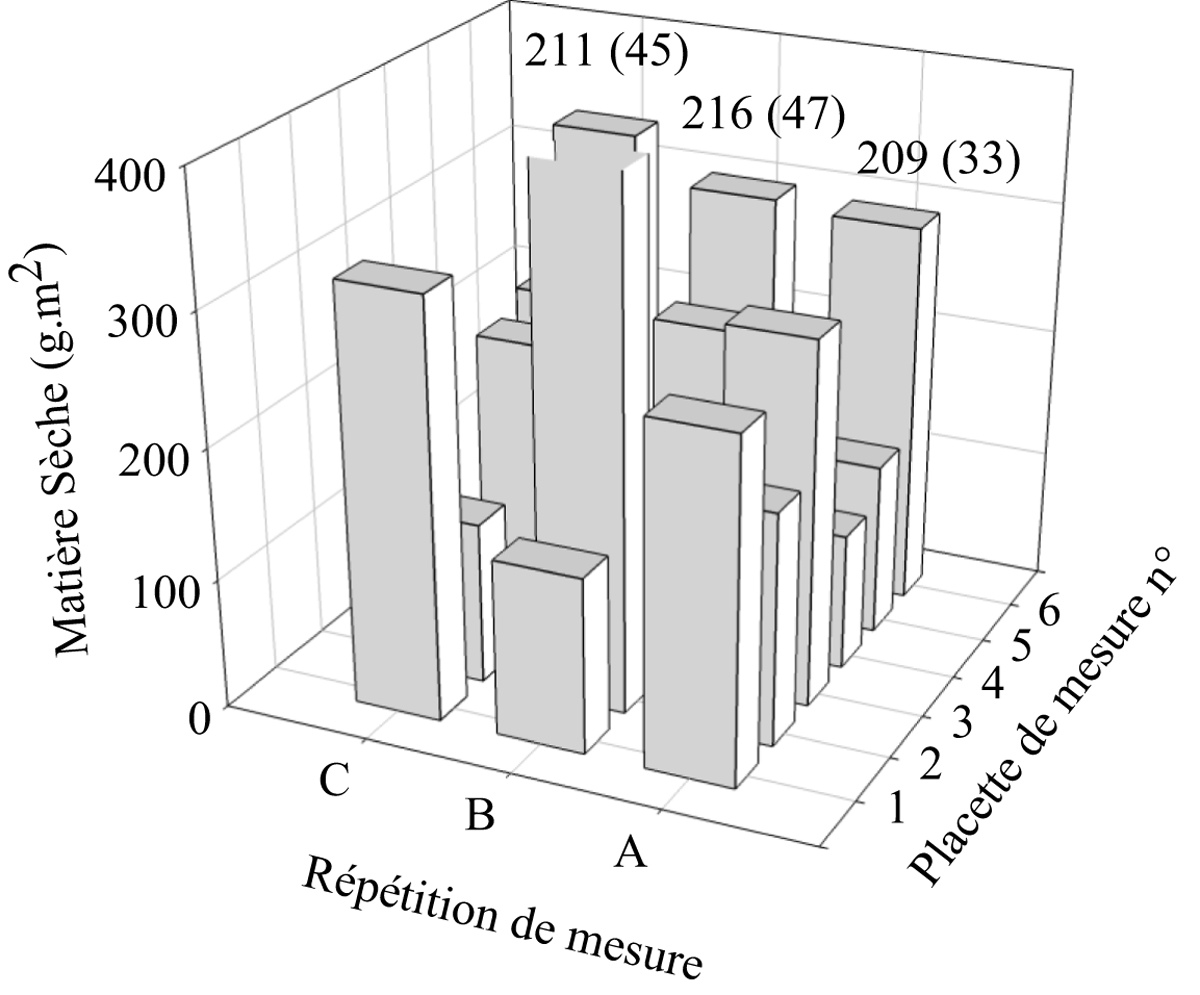
Exemple de variabilité spatiale observée sur un transect de la moissonneuse après une récolte de pois.
Example of the spatial variability of pea residues collected in six microplots along a transect perpendicular to the direction of harvest, with three replicated transects.
Current usage metrics show cumulative count of Article Views (full-text article views including HTML views, PDF and ePub downloads, according to the available data) and Abstracts Views on Vision4Press platform.
Data correspond to usage on the plateform after 2015. The current usage metrics is available 48-96 hours after online publication and is updated daily on week days.
Initial download of the metrics may take a while.