")
")
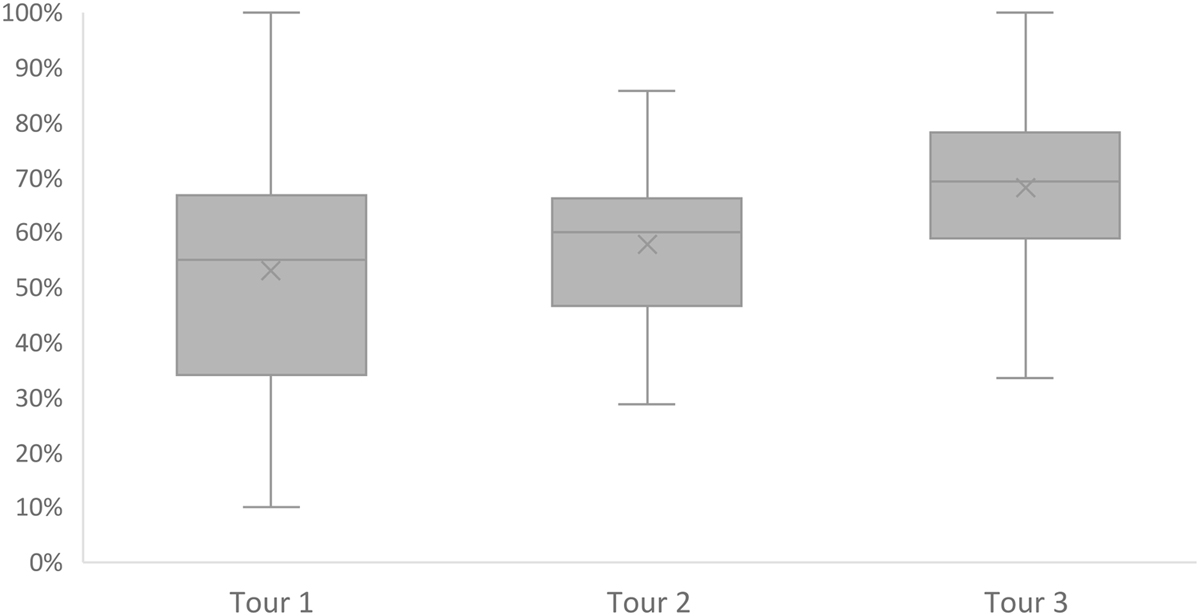
Fig. 5
Download original image
Évolution sur trois tours des dépenses consacrées à la gestion de la mouche des fruits, pour toutes sessions confondues (village de Kayakh exclu pour cause d’évolution du jeu). Dépenses exprimées en pourcentage des dépenses totales. N = 72, p = 0,0407. La ligne centrale des boites à moustache représente la médiane et la croix la moyenne des valeurs.
Evolution over three rounds of spending on fruit fly management, for all sessions combined (Kayakh village excluded due to game evolution). Expenditure expressed as a percentage of total expenditure. N=72, p=0,0407. The central line of the boxplot represents the median and the cross the mean of the values.
Current usage metrics show cumulative count of Article Views (full-text article views including HTML views, PDF and ePub downloads, according to the available data) and Abstracts Views on Vision4Press platform.
Data correspond to usage on the plateform after 2015. The current usage metrics is available 48-96 hours after online publication and is updated daily on week days.
Initial download of the metrics may take a while.